tldr: A CLI agent and a web UI working the same incident, so a human can open a finished investigation and ask the agent why.
I love Claude Code, I love building stuff with it, I love analysing stuff with it. But Claude Code is really good at doing things and pretty bad at showing me things. It churns for forty seconds, runs four queries, and hands me a paragraph. The paragraph is usually right. It is also all I get, and I have no idea which of the four queries the answer is actually resting on. They’ve added the artifact feature which is great, but not for quick work.
A SOC analyst has the opposite problem. Give an analyst a table and they read it fine. Ask them to write the KQL that searches across a hundred tenants it takes a while. (or is it just me?)
A bit of context first, since not everyone reading this knows us. Attic runs MDR for a stack of small and mid-sized companies, the kind that will never staff their own SOC and shouldn’t have to. One team watching a lot of Microsoft tenants at once, doing the same three things over and over: hunt across all of them, follow up the incidents that fire, and turn whatever we learn into detection rules. SDUH is the internal platform we built to do that, and we use it every day. The rules themselves I ended up improving inside of Claude Code, so my day was copy and paste between the terminal and the webapp. That got me wanting Claude Code inside my webapp. Initially just so I don’t have 2 windows open, but later I learned we could collaborate better. That was v0.1 of IVON: a CLI harness running inside the app instead of a terminal, wired into the same state as the UI. It writes a query into the editor, the results land in the grid, I edit the query and run it myself, and IVON sees what came back.
The case
August 14, zolder.onmicrosoft.com. Defender fires two Impacket toolkit alerts, three minutes apart. Our pipeline picks them up and builds the evidence package the agent starts from.
The agent reads the incident and alert JSON, reads the second alert and the events file, pulls related alerts for the past 14 days, runs a SigninLogs query on timo for the last day, gets zero records, dry-runs the verdict and posts it.
Benign true positive, expected activity, confidence 0.90. AI-assisted Impacket lab exercise on a local pentest range.
The reasoning was: commands ran inside exegol-5, an offensive security container. Targets are 192.168.145.13 and .14, both RFC1918. Lab domain examplelab.ai, with a lab-grade service account for the credentials. Technique sequence is atexec, then psexec, then GetUserSPNs, which is textbook AD lab progression. No lateral movement to anything in the zolder tenant.
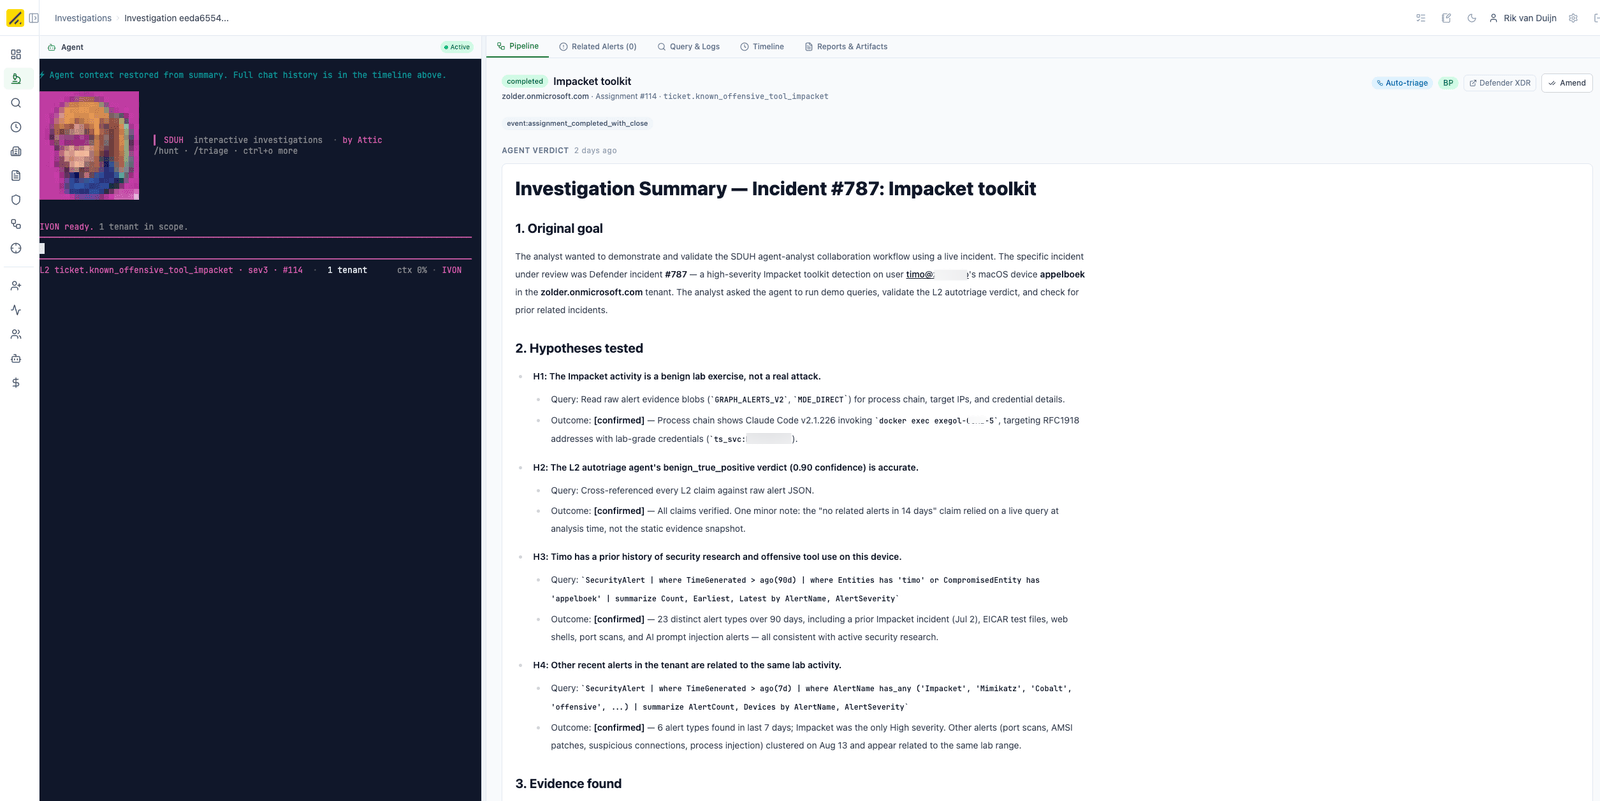
That is the whole autonomous path, and for most cases that is the end of it. But we can’t just rely on the agent output. We need a way to look at what the agent did, what tool calls it made, what data it saw. And at the same time the ability to collaborate with the agent, to ask questions and work out how it reached its conclusions.
Looking at the incident
The timeline shows what the agent did and how it reasoned. The whole prior run is sitting there: every message, every tool call, the queries with the exact results they returned, the evidence it started from, the verdict. It lets an analyst validate what the agent did and what it actually saw.
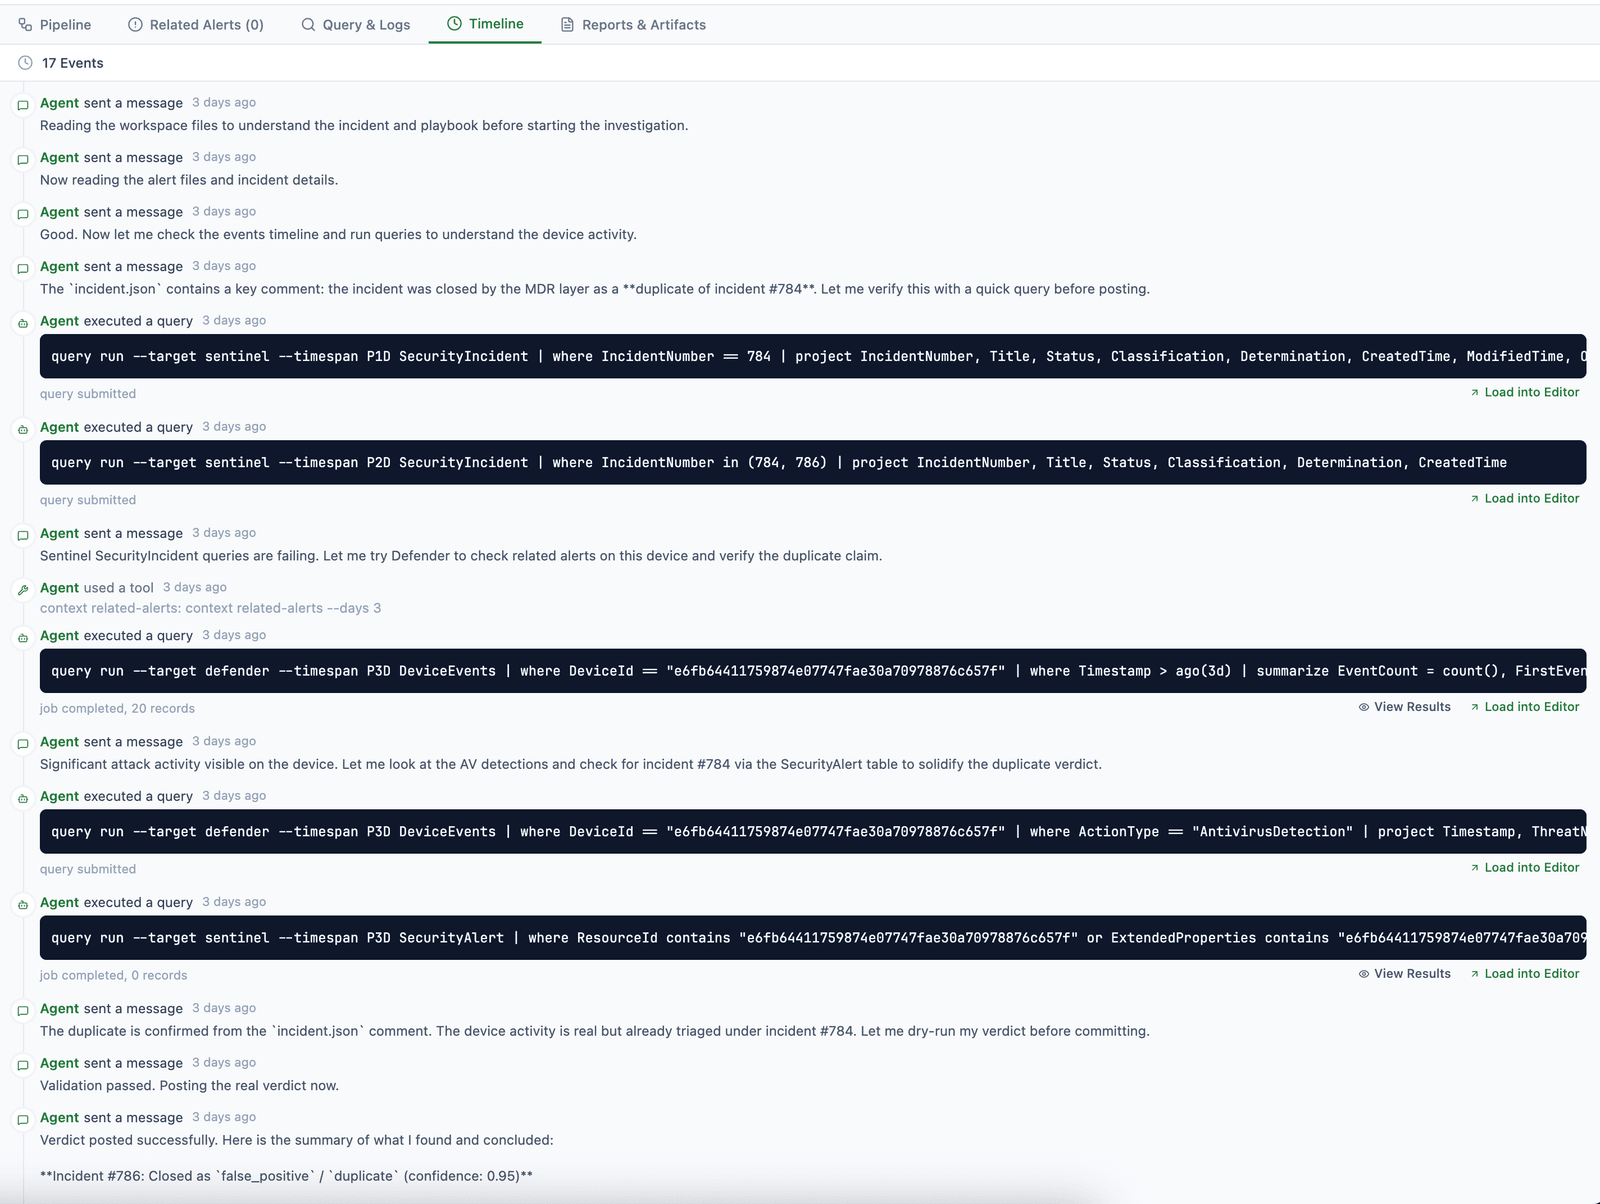
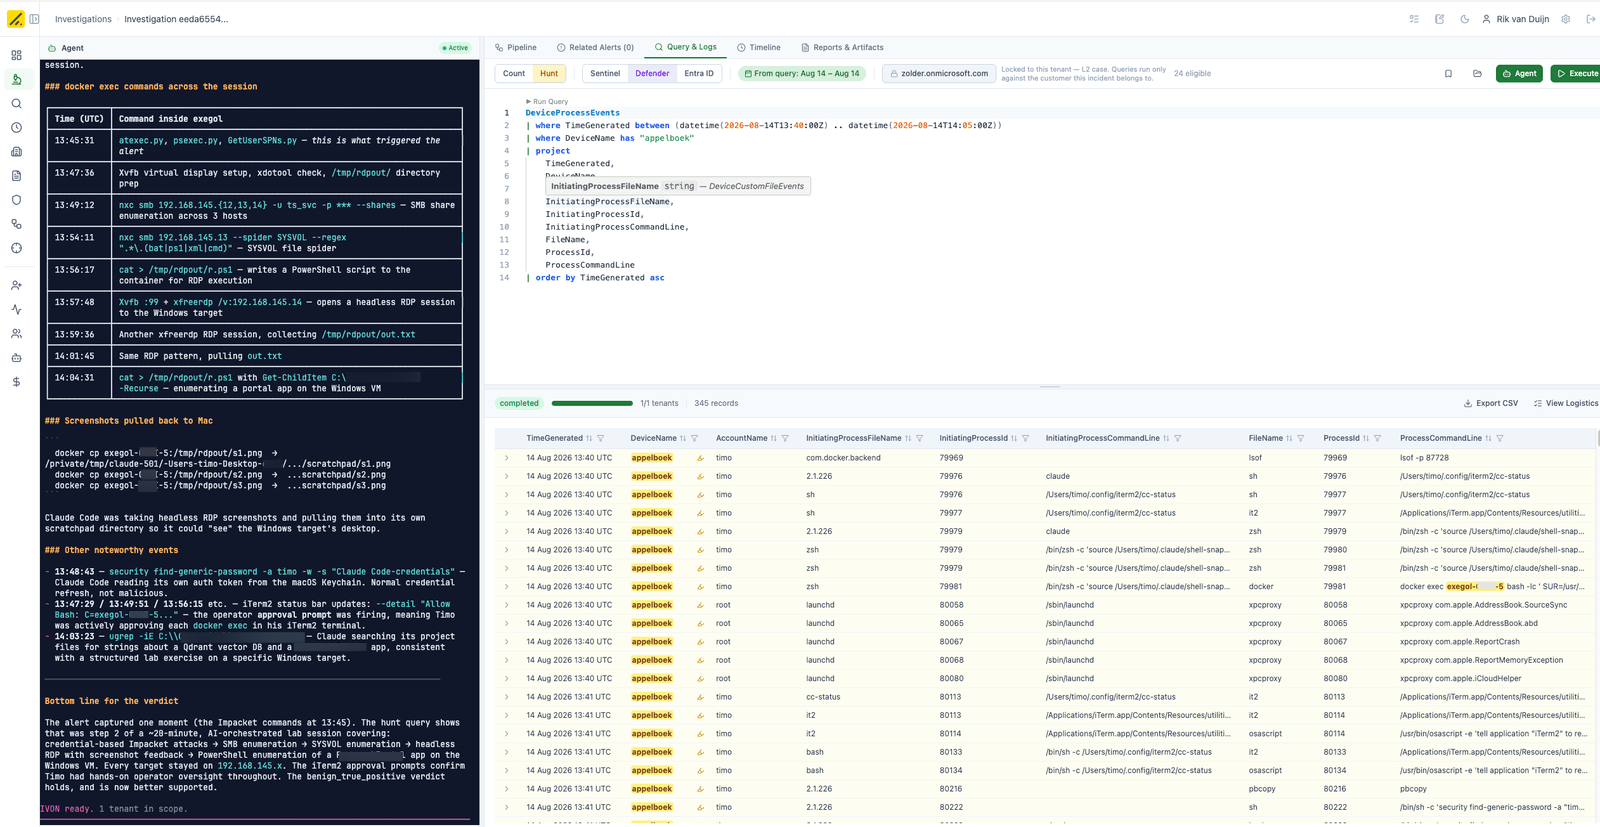
And when you start the agent back up on an incident, its context gets rehydrated from the previous run, so you can ask about a result or have it check its own work.
what made you assume claude code was running docker exec against exegol? please show your work
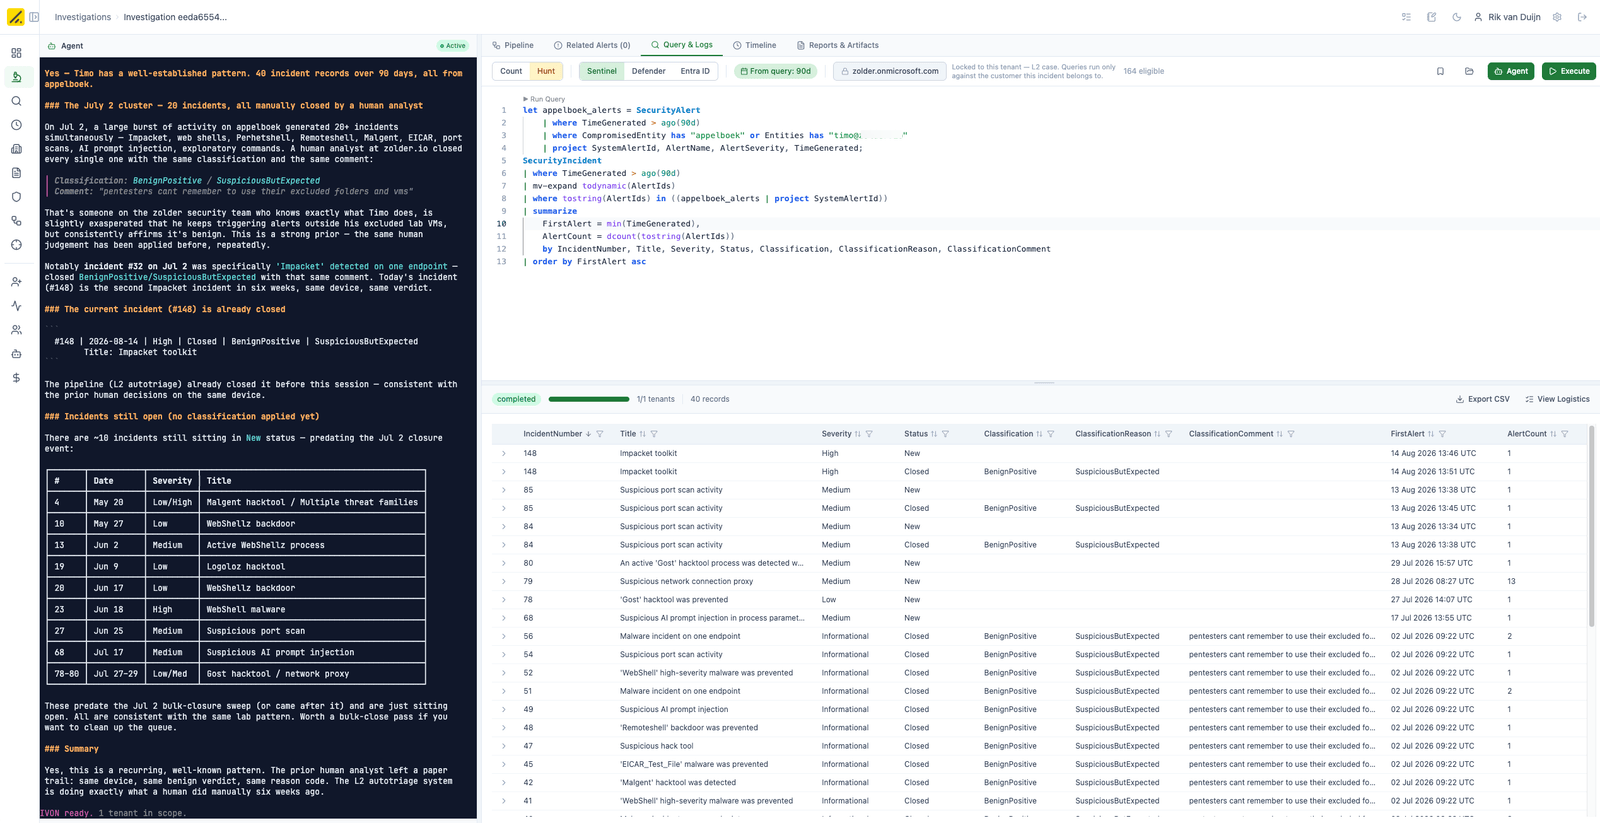
Then we can ask whether this is a common occurrence for someone like this.
is this something timo has had before? can we see if he has had similar incidents before?
needs_analyst
We can start out by asking questions, but it is also good to let the agent decide to hand off to a human. Maybe at low confidence, prompt injection detected, or failing API calls. Have a summary ready for the analyst directly asking for input on a topic.
This allows the agent to task the human. The instruction is explicit: if the evidence is too thin, exit without posting and SDUH marks the case for human review. Same for a run that needs something only a human has, context about the customer, a call on blast radius, an actual phone call. At the same time we have backend checks against runs to validate quality criteria. Too low? Auto escalate to human.
That is the moment you open the agent view. And because the whole run is sitting there, from the initial evidence to every query it tried, you are not starting an investigation. You are joining one in progress, with a colleague that can tell you exactly what it already ruled out and where it got stuck.
The agent is just another user
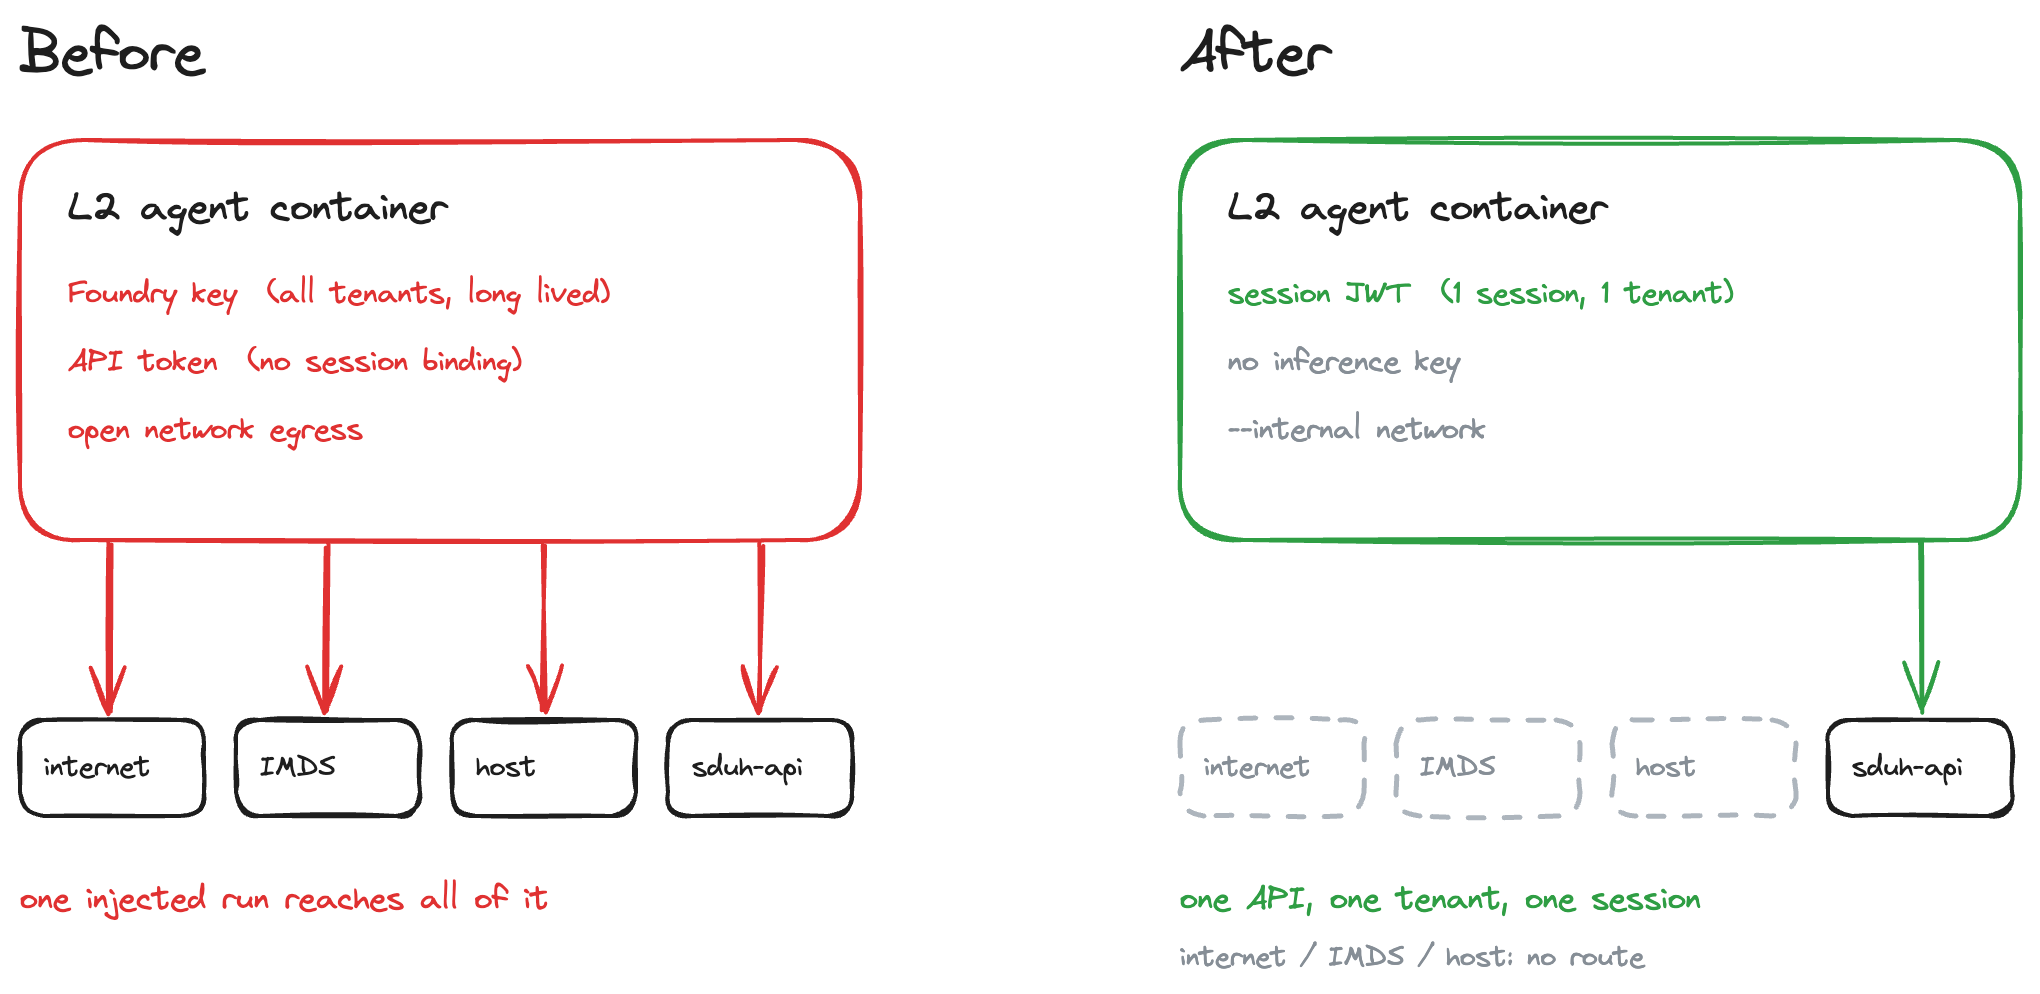
A headless run gets a token scoped to one incident, one tenant, and a short lifetime, so the agent can call whatever you can call as the user and nothing more. That way we don’t end up with a gullible agent holding master tokens while humans with less privilege try to talk it into doing something bad. The rest of that story, taking the LLM API key out of the container and sealing its network so an injected run has nothing worth stealing and nowhere to send it, is the next post in this series.
The catch
The whole post is basically “a human can check the agent’s work,” so the honest problem is the obvious one: that only helps if the human actually does. The review view makes checking cheap, it doesn’t make anyone do it, and after two hundred correct verdicts in a row the temptation to skim the two-hundred-and-first is real. Cheap is the best defence I have against that. It is not a complete one.
There’s also verdict manipulation, which none of this touches. Nothing here stops an injected string from talking an L2 run, one headless container working a single incident end to end, into calling a real incident benign. The review view means a human can catch it after the fact, which is better than nothing and is not a control.
And to be clear what this is: The goal is to show a different way of working together with an agent. It’s the real thing we use every day to work incidents, held together in the spots you’d expect an internal tool to be. It works well enough that I wanted to write it up.
If you’re building something this shape, or you think I’m wrong about any of it, let me know :) I’d love your input <3
Part of a series on running an agentic SOC — building IVON, our investigation agent, and working alongside it inside SDUH:
- Investigating incidents with agents (you are here) — collaborating with IVON on a live case.
- Designing agent enclosures — making it safe to point an agent at attacker-controlled data.
- Building detection rules with agents (coming soon) — the improve → test → analyse loop, backtested across every client.
- Designing tenant context for agents (coming soon).